Navigate this blog
In this post
How Do Machines Learn without Supervision?
In my previous blog, How Do Machines Think and Learn?, I introduced the concept of learning but also provided a perspective on what I consider as “thinking”.
The machine analyses the underlying patterns in the data to predict an output.
The earlier case we explored was the supervised approach to learning, where the machine is trained on a labelled dataset. With every iteration, the aim is to get the predictions closer to the actual output. The key factor here is that the machine is learning under supervision, and we have a harness (to get you familiar with recent terminologies) to control the learning process.
What happens when we do not have that supervision? Does the machine wander off, learning patterns on its own? How do we measure its performance? What constitutes the harness?
Let’s explore!
The Unsupervised Problem
Another popular learning approach in Machine Learning is the unsupervised approach.
Here, the input dataset is the primary source of information for the machine to learn from. Unlike supervised learning, we do not provide explicit target labels for each data point. Instead, the machine attempts to identify patterns, structures, and relationships within the data.
The guidance comes from the learning algorithm, its objective function, and the hyperparameters that control how the learning process works. The data itself provides the context for learning. Together, these form the harness within which the machine learns.
Let’s look at three interesting problems in the unsupervised approach.
1. Clustering
What is the machine trying to learn here?
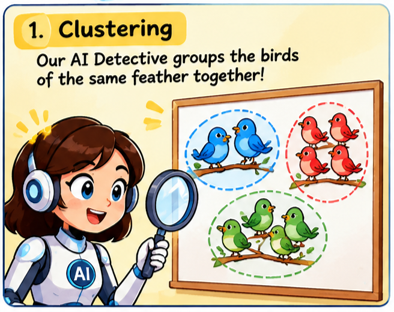
It thinks through the data to identify patterns and starts grouping similar data points together. The objective, in approaches such as K-means, is to minimise the distance between data points within a group while keeping the different groups (or clusters) as distinct as possible.
The classic “birds of the same feather flock together” approach, except that the machine decides which birds would flock together!
But who controls the number of clusters or groups?
This is where the domain expert meets the ML expert. It is important to study and understand the business use case at hand to make that decision.
We also have statistical methods that help us arrive at a reasonable estimate of the number of clusters (e.g. Elbow Method, Silhouette Score, Gap Statistic)
However, these methods do not necessarily tell us the correct number of clusters. They help us evaluate different possibilities. The domain expert still needs to determine whether the resulting clusters make sense in the context of the business problem.
Also, not every clustering algorithm requires us to specify the number of clusters beforehand. For instance, DBSCAN uses density-based parameters to identify clusters.
2. Association Rule Mining
A concept borrowed from the Data Mining discipline (visit my first blog, Before the AI Boom: A Look Back in Time! to get an understanding of how these fields overlap).
The machine analyses the data to identify patterns in how data points or items are associated with each other.
For instance, a data point A is likely to be seen with data point B and rarely with data point C.
Think of the classic buyer behaviour analysis.
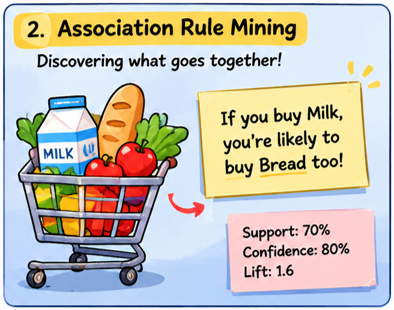
Shopping malls and retailers study customer transactions to understand which products are frequently purchased together. For instance, they might observe that customers buying milk are also likely to buy bread.
Now, imagine that the retailer notices this pattern across several customer transactions. They could use this information to rethink how products are arranged on shelves, design promotions, or recommend complementary products.
But how does the machine determine whether these associations are meaningful?
This is where frequent pattern mining and association rule mining algorithms come in.
Three commonly used measures help us evaluate these associations:
- Support: How frequently do milk and bread appear together across all transactions?
- Confidence: Among all transactions containing milk, how many also contain bread?
- Lift: Are milk and bread purchased together more often than we would expect if their purchases were independent?
A lift greater than 1 indicates a positive association, while a lift of 1 indicates that the two items are statistically independent under this measure.
Of course, association does not necessarily imply causation. Just because two products are frequently purchased together does not mean that buying one causes a customer to buy the other.
I’d like to think of this learning approach as sketching a mind map (my favourite activity!).
When I’m working on a research topic or a topic of interest (which could just be me and the plethora of tasks I have to complete, or everything I have to deal with at present), I start associating one item on my list with another. This helps me see how these tasks correlate or associate with each other.
This is how the machine identifies relationships between items, guided by frequent pattern mining algorithms.
3. Spotting Anomalies vs. Novelty
Another set of algorithms closely related to the unsupervised learning approach uses variations in the data itself to help machines learn patterns.
For instance, a machine is trained on a dataset containing predominantly homogeneous data (for lack of better words, data that belongs to the same class or represents normal behaviour).
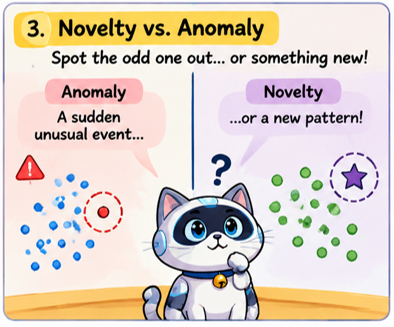
Once the machine has learnt the underlying patterns, we introduce a new data point. If it deviates significantly from the patterns the machine has learnt, it can be flagged as an anomaly or an outlier.
This is the basic idea behind anomaly detection.
A slight variation of this is novelty detection. Here, the machine is trained on data assumed to represent normal behaviour, and the objective is to identify new observations that do not conform to the learned pattern.
So, is every new behaviour anomalous?
Not necessarily!
A new observation may simply represent a pattern that the machine has not encountered before. It may be perfectly legitimate, even though it is unfamiliar.
Let’s take a simple example.
Imagine training a model on images of dogs belonging to a few known breeds. Now, introduce an image of a Chihuahua, a breed that was not represented in the training dataset.
The machine may recognise that the image does not quite match the patterns it has learnt. But that does not mean the Chihuahua is an anomaly, or that it should be classified as a cat!
This brings us to another interesting area: open-set recognition, where a model must recognise when an input belongs to a category it has not been trained to identify.
In cybersecurity, this distinction becomes particularly important.
A system may learn the normal patterns of user logins, network connections, or process behaviour. A sudden deviation could indicate suspicious activity, but it could also be a legitimate change in user behaviour or the introduction of a new application.
The challenge is to distinguish between something unusual and something genuinely malicious.
And that is where domain knowledge becomes essential.
How Do We Measure Performance in Unsupervised Learning?
This is an interesting question.
In supervised learning, we have labelled data against which we can compare the machine’s predictions. We can calculate the error between the predicted and actual outputs and use metrics such as accuracy, precision, recall, and F1-score.
But what happens when we do not have labels?
How do we know whether the machine has learnt something meaningful?
The answer depends on the problem we are trying to solve.
For clustering, we can use measures such as the Silhouette Score, which gives us an idea of how well-separated the clusters are. A score closer to 1 generally indicates better-defined clusters.
For association rule mining, measures such as support, confidence, and lift help us understand how frequently items occur together and how meaningful those associations are.
For anomaly detection, things get a little more interesting. If we have labelled data available for evaluation, we can use metrics such as precision and recall to assess how well the system identifies anomalies. Without labels, we may need to rely on domain expertise and investigate the observations flagged by the model.
And what about the loss function?
Well, different algorithms optimise different objectives. For instance, K-means tries to minimise the distance between data points and their respective cluster centres.
So, there isn’t one universal performance metric or loss function for unsupervised learning (we’ll explore this in a little more detail later). It all depends on what we are trying to achieve and what the algorithm is designed to optimise.
How Do I Combine Unsupervised and Supervised Learning?
Why not?
In practice, we often combine both approaches to solve real-world problems.
We don’t get labelled datasets everywhere. It is a painstaking journey to obtain the right labels. Even with GenAI assistance today, the initial labelling of a dataset to train a model is a task in itself and requires domain expertise.
This is where unsupervised approaches come in handy.
They help practitioners discover initial patterns and group similar observations, which can accelerate the labelling process.
Once we have partially labelled the data, we can train a supervised model to learn from those labels and predict them for newer data points.
Let me share an example from my own experience.
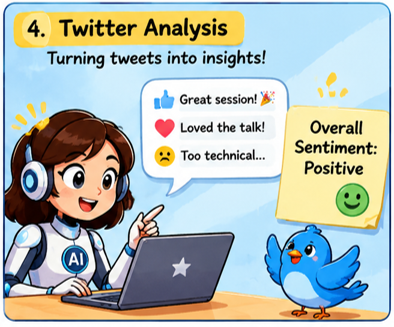
When I was working on a sentiment analysis task to gauge the sentiments of cybersecurity conference attendees, we collected tweets (back when it was Twitter!).
We implemented cluster analysis using K-means to identify groups of tweets with similar patterns. We then examined the clusters, interpreted them, and used the resulting labelled dataset to train a small Logistic Regression classifier to predict sentiment labels for newer tweets.
We also experimented with building some Deep Learning models, but more on that later!
This is one example of how unsupervised learning can help us make better use of unlabelled data before moving towards a supervised learning approach. Once we had the two clusters, we manually examined and labelled them as positive and negative sentiments. However, sentiment analysis in cybersecurity comes with its own set of challenges. Words that are generally associated with negative sentiment may carry a positive or neutral connotation in a cybersecurity context. This becomes particularly important when working with sentence embeddings and pretrained language models, where domain-specific context matters. The models need to be appropriately adapted to the cybersecurity domain to capture these nuances.
So, Can Machines Learn Without Supervision?
The answer is yes!
But does that mean the machine is learning without any controls?
Not quite.
The learning process is still guided by the algorithms, their underlying objectives, the data provided, and the parameters and hyperparameters configured by the practitioner.
The difference is that we are not explicitly telling the machine what the correct output should be for every input.
Instead, we are allowing it to discover patterns and relationships within the data.
Does learning end here? Or are there other approaches people have tried to make machines learn?
Until then, keep thinking, keep learning!
#ArtificialIntelligence #MachineLearning #UnsupervisedLearning #DataMining #Clustering #AnomalyDetection #Cybersecurity #TheThinkingCap
(Note: Images used in this blog post were generated with the help of ChatGPT.)